Monday, April 26, 2010

Final Carto Project: SAT Scores


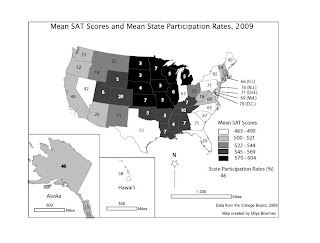
The caption for this map is
State mean SAT scores and SAT participation rates. In general, as a greater proportion of a state's high school graduates take the SAT, the state mean SAT scores fall, and vice versa.
This map was our final project. We were given a link to a table with either ACT scores or SAT scores, and state participation rates. We had to pick SAT or ACT, create the map from the data, and include both scores and state participation rates. I typed the data into an Excel file, joined the Excel file to a state boundary file in ArcMap, and once I had symbolized the mean SAT scores on a choropleth map, exported it as an Adobe Illustrator file so I could position the state participation data as numbers on each state.
Initially I downloaded from the web a free, recent TIGER census state boundary file to join to the SAT data. This worked really well right up until the point in Adobe Illustrator when I was almost finished with adding the participation rates and discovered that Michigan was unrecognizable because the TIGER folk had generalized the state's boundaries to include (i.e. to swallow) Lake Michigan. Concluding that the average newspaper reader would be confused too, I discarded the map and after some unsuccessful web searches, hunted down an ESRI shapefile at my local university's (UNC-Chapel Hill) GIS data depository.
The process for this project was fairly straightforward. I am least pleased with the size of Alaska. I wanted everything to the same scale, and I know it is supposed to be bigger than Texas and California (and a few other states) combined, but I now think the map would have been improved if I had scaled Alaska down a bit to match the size of the rectangle around Hawai'i. I put Hawai'i and Alaska in separate data frames so I could manipulate them into the same layout; I tried to exclude them on the main data frame with a definition query but failed, so I moved the mainland on the screen to remove them instead.
This map is an interesting example of how data left out can mislead. Without the state participation rates, one might understandably assume that for some reason the high school students on the east coast were dullards and those in the midwest and south - except for Texas - were a bright bunch, or at least had better education through high school. Adding participation rates is clearly an improvement, although more information overall would be useful so we might know just who writes the SAT in each state and how they compare with those in other states.

Tuesday, April 6, 2010

Week 11: Using Google Earth


This week our task was to locate a suitable site for a wind farm somewhere in Ohio and then put a placemark at that spot in Google Earth. We were given links to information about criteria for suitable sites, and links to some maps.

Fundamentally, the wind turbine site has to have a minimal average wind speed. Additional criteria mentioned on the BERR website include landscape and visual impact (related to tourism though not entirely), ornithology (Bird migration patterns), noise (related to distance from dwellings), shadow flicker (ditto), and shipping impact (here, around the Great Lakes).

I started by downloading a wind map. I first found the 80m wind power map of Ohio produced by the US Department of Energy’s National Renewable Energy Laboratory. Later I found a 50m version (better resolution) of the same map, also by the NREL, dated 2004. In addition, the summary report by the Health Assessment Section of the state’s Bureau of Environmental Health (March 2008) notes that the “best areas for utility-scale wind turbines are Lake Erie off-shore, the Lake Erie shoreline, and topographically-elevated portions of….Logan, Champaign, and Hardin Counties” (p. 2).

After looking at maps of the Great Lakes shipping routes and at another map of Ohio state parks, many of which are along the Lake Erie shoreline, I decided that siting wind turbines in Lake Erie was likely to be problematic not only for shipping but for tourism reasons – there would also be considerable recreational boating in the area - and wind turbines here would therefore probably be subject to considerable opposition. I returned to Logan, Champaign and Hardin counties.

Next I pasted together three small printed maps of census 2000 block group population, one for each of these three counties: I got the information from the FactFinder section of the census.gov website, which allows you to map a variety of demographic characteristics, including population, down to the block group level, and which I have found very helpful in the past. This gave me a general idea of areas to avoid: in each of these counties there is a population concentration more or less in the center of the county.
On to the pasted-together county maps I did a sketch of the areas on the NREL map that had the highest wind power classification (6.4 – 7.0 m/s at 50 m).

I consulted the npwrc.usgs.gov website about migratory patterns of birds, but those were so general that all I could tell was that some birds would be migrating across this section of Ohio.

USGS.gov has downloadable topographic maps, which would have helped to determine the hillier areas in the counties, but unfortunately the maps are so tiny for the amount of detail on them that it is almost impossible to determine where the high elevations are. I did conclude that it would be better to have the wind turbines on the west or southwest side of hills, partly because the wind will be coming from that direction and partly because there will be more shade to the north of the turbines; but I am not confident that my final choice is actually on a hill because I couldn’t make out the topography in Google Earth or on the downloadable topo maps - I don't have the experience using Google Earth to make out hills, and I don't think Ohio has many hills that are too steep for growing crops in regularly-shaped fields..

I also checked a map of state parks. Many of these are on the Lake Erie coast, as mentioned, but there is also one in Logan and one in Champaign county, each of them in the northwest portion of the county. The wind power areas from the NREL map were chiefly in eastern and northeastern Champaign county, in eastern Logan county, and in a couple of spots to the south and west of Hardin county.

My final site is in southern Hardin County, a little north of the border with Logan county. It is in a rural area, not close to any parks or any large population centers. I think this section is a bit higher - at least it's supposed to have higher wind speed - but I can't be certain. The problem with dealing with Google Earth and GIS maps - at least in this instance - is that although the resolution of Google Earth is very good, we don't have the other, lower-resolution GIS data superimposed on it, so at least in my case, the final wind farm site may not be in the best spot. I'm hoping the people who actually make these decisions do have integrated data! I do think Google Earth is a fabulous tool and has marvellously specific resolution which I have used on a number of occasions, and I know there will be other interesting things to do with it in the future.