Wednesday, September 29, 2010

Week5: Carbon Sequestration and Tree Cover


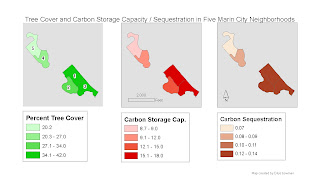
This week we had to calculate tree cover from our previous week's raster creation. Last week we had to generalize a raster that was classified into 50 classes (or 25 if ArcMap kept crashing), and generalize it to 3 classes: trees, grass and impervious surfaces. (So that's how it's done!) This week we calculated the area of the tree cover as a percent of the whole, and also did some carbon sequestration calculations. The three resulting maps (shown here) are quite similar. The 2nd and 3rd display, carbon storage and carbon sequestration, are really the same thing multiplied by a different constant.
This week I learned more (than I wanted to know, really) about the Field Calculator, but it was useful. I also discovered how to join the five neighbhorhoods that we focused on, using the Append function. That was useful too.
Last week we had the task of joining 7 smaller rasters into one big file. This didn't go at all well for me until Mari suggested using mosaicking, a technique I had never used before but that was very useful and worked like a charm.
All in all things are going pretty well. Except for the eyestrain this week...

Monday, September 20, 2010

Week 3: Mapping Proximity to Target Population and Asthma Triggers


For the final week of this asthma-related project we had to do a proximity analysis to show which Alameda county hospitals were a) close to census tracts with a high proportion of black residents, the target population (I used more-than-50%-black; most of the census tracts were near South Berkeley and in Oakland), b) close to major roads (buffered by 0.1 mile), and c) close to Toxic Release Inventory (TRI) facilities (buffered by 0.5 miles). All went fairly well until I got to the point of doing Euclidean Distance for each of the inputs (hospitals, high-black-pop, TRI and roads). First I made at least 20 tries to endeavor to figure out which of the "environments" and "analysis" settings for the Euclidean Distance function did what. Eventually I discovered the distance between a mask, which could be the shape of a shapefile if needed, and the raster analysis extent, which is a rectangle. (Perhaps I was told this earlier - but if so, I had forgotten.) I also discovered that if you set the analysis extent to "extent of display", and adjust the display, the distance radii become longer or shorter. It was an instructive, if frustrating, process. I was pretty excited when I finally got it straight, but it was a long road to enlightenment.
Perhaps I shouldn't have shown this map, since it makes glaringly obvious the difference between the outline of the Alameda County boundary shapefile (the western part, where I did the analysis, is in color) and the outline of the Alameda County census tract shapefile (that grey thing sticking out at the bottom is a high-black-percent census tract that extends beyond the Alameda County boundary shapefile that I intersected with the analysis extent). However it does show the areas where the hospitals are close to a combination of high black population, major roads, and TRI facilities (closest hospitals are in the lightest yellow section). I made the black population file the most important (worth 60%) when I did the weighted overlay of the four files (hospitals (10%), TRI (15%), roads (15%) and black population) because the most important thing is for the hospitals to be close to where the target population is.

Tuesday, September 7, 2010

Fall Week 1: Preparing Data for GIS & Public Health


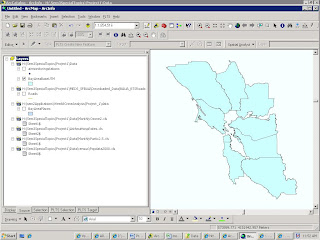
In this first 3-week section, we will be producing maps of Bay Area demographics as well as asthma hospitalization rates and some pollution indices. As part of the preparation, we had to compile a metadata chart containing the layers we would need to use. I can't for the life of me figure out how to link it to this, so instead here (to the left) is a screen shot of the layers I plan to use; below is a link to the same thing, only bigger.
I haven't included anything in this screenshot other than the outlines of the Bay Area counties. I'm still having some problems, with a) having a correct, or complete, roads file - although the roads aren't crucial for the public health part, I think, so far; and b) with the correct projection for the air sampling stations, which so far has eluded me. Maybe by next week...