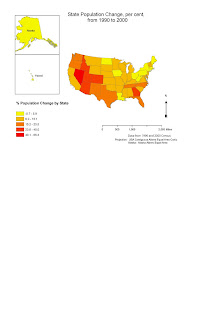

For this week's assignment we first had to create a simple color cloropleth map of population change state by state in the U.S., open the map in Adobe Illustrator and make a few more changes as needed. This went reasonably well until the Illustrator part, although I also had problems with projection because we had to include Hawaii and Alaska on the map. Eventually I put Alaska in a different data frame (and different projection). The map ended up having about three different data frames and I had trouble arranging them all.
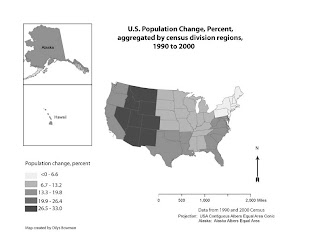
For the second, grayscale, map, we had to open an Excel file of the 1990 and 2000 population figures for each state, calculate the percent change in population for each state, and aggregate the data into averages for each of the regional census divisions (there are 9 of these). The range of values for this second map had to be categorized on an equal interval scale, unlike the color map (map #1), the data for which was categorized according to natural breaks. Then we had to open the first map in Adobe Illustrator, convert the colors for each state to grayscale, and assign the correct color on the grayscale scale to each state, according to where it sat in the census division region. This tinkering also included redoing the numbers for the legend. This wasn't quite as bad as I thought it wuold be, as I am now figuring out how to organize layers and objects in Illustrator, more or less.
Only map #2 (grayscale) is in landscape format, but #1 will have to stay in portrait orientation for now, as I only managed to save the file for #1 in the right format when I was halfway through the changes to the map to make it into #2!
Good job Dilys! Individual data frames was the key. There is a slight error on Alaska with the shading and an extra space in Percent.
ReplyDeleteLeah