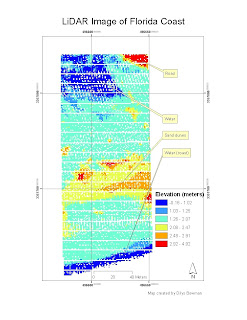
This week we learned how to import a .txt file of raw LiDAR point data into ArcMap, convert the data into a raster image in ArcMap and transfer that image back into ERDAS. This wasn't so hard; the difficult parts for me in the challenge part of the lab were
a) figuring out the scale (until I read the .xml metadata file and realized what the projection was I kept getting impossibly small figures for the scale),
b) wondering where on earth I was - when I was still confused about the scale I did discover - by checking the coordinates into Google Earth - that the location must be the Florida coast again and not in the middle of Iran as I thought for a perplexed moment! - and
c) 'reading' the raster image to figure out which was road and which was sand dune. The road, I concluded, was the part at the top right (it shows up in red in this image) with fairly uniform elevation and a longish straight side, but it took a while before my different classifications showed that. I think I got it eventually - it was initially hard to see. With the manual classification I did (I chose not to use a "stretched" continuum of color) I found it easier to find the road. I ended up creating a rather luridly colored image but water shows up clearly, here as blue (because the elevation is near zero) and sand dunes are yellow and orange. The whole process did reinforce for me what a rube I am when it comes to remote sensing. If only I'd taken a full semester of it when I had the opportunity!
No comments:
Post a Comment